


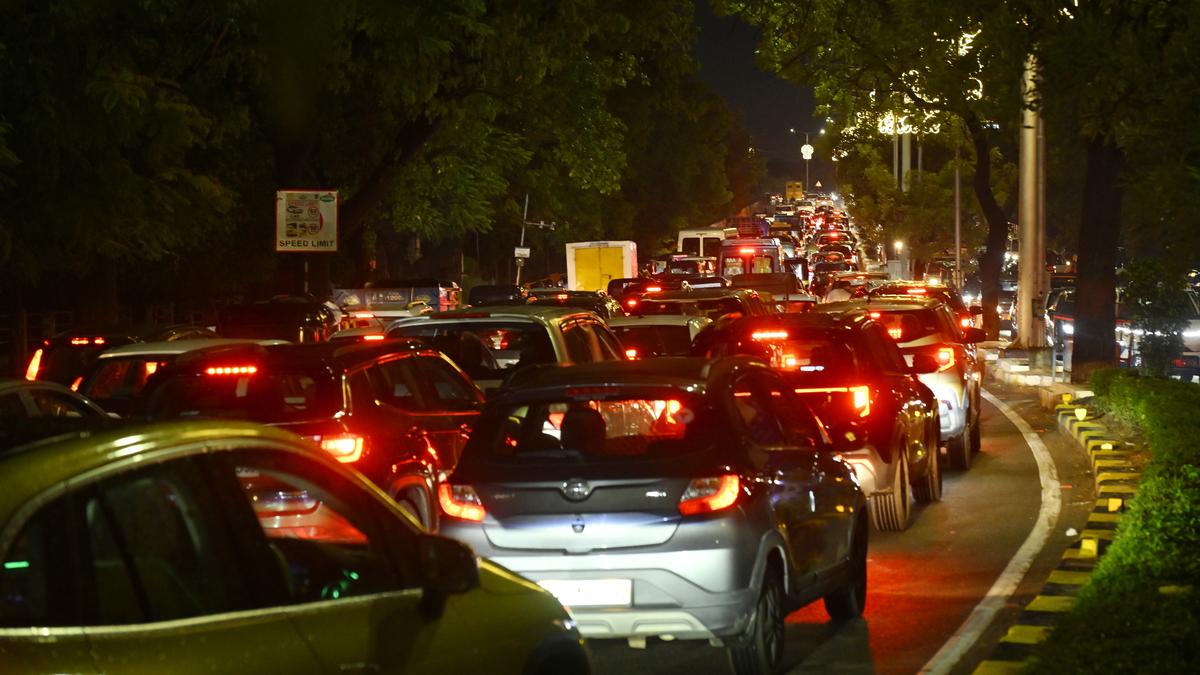

Traffic comes to a grinding halt across several parts of Hyderabad.
| Photo Credit: NAGARA GOPAL
Inside the Hyderabad Traffic Control Room, a wall of screens show vehicles moving steadily along a major corridor. Yet, on a mobile phone, Google Maps paints a different picture — the same stretch marked in deep red, signalling heavy congestion that doesn’t match the live feed in the control room.
Such mismatches between what is on the ground and what the navigation apps indicate have become common, particularly during the rainy season. For commuters, they can mean the difference between a quick trip and an unnecessary detour. For traffic managers, they create confusion, trigger complaints and sometimes lead to inaccurate perception of road conditions.
According to a police officer, the differences stem from the way Google Maps collects and processes data. Instead of tapping directly into city surveillance feeds or counting vehicles, the platform relies heavily on crowd-sourced location data from mobile phones. If a cluster of users in the same area is stationary or moving slowly, whether due to a traffic signal, weather, or even a tea break, the system may interpret it as a traffic jam and reflect that in its colour-coded maps.
Google Maps says it integrates real-time traffic information, including accident reports and road closures or diversions, from various sources and analyses historical traffic data to estimate current conditions and predict near-future speeds. Technology expert Rajeev Krishna explained that the platform measures average speeds over small stretches of about 50–100 metres, then adjusts these figures using historical data for the same day and time. “If vehicles wait at a red light for five minutes at zero speed, then move for one minute at 10 kmph, Google’s average becomes roughly 1.6 kmph. It’s never truly live, it’s an average,” he said, adding that in places where police manually alter signal timings, the estimates often fail.
“Google might flag deep red, but our cameras show a moving traffic,” said an official from the Hyderabad traffic control room, adding that police decisions are guided primarily by live CCTV feed and on-ground intelligence rather than app-based data.
Mr. Krishna believes a formal data-sharing framework between the government and Google could make traffic predictions more reliable and enable better emergency response.
The idea of closer integration has been under discussion for some time. In February 2025, Hyderabad Police and Google explored options for linking real-time Maps data with automated signal controls based on vehicle counts and using cloud-based AI to store and quickly retrieve CCTV footage for analysis.
Custom traffic insights for Hyderabad
Two collaborative projects are already in the pipeline — Green Signal (to suggest signal timing tweaks) and Road Management Insights (RMI). Joint Commissioner (Traffic) D. Joel Davis said these aim to tailor Google’s extensive data for local needs. “The model gives us insights into road and traffic patterns such as which corridors are busy at a given time, travel times on specific routes, types of congestion and historical trends,” he said. While Google Maps has vast amounts of raw data, Mr. Davis noted it is not in a format directly usable for law enforcement. Under the partnership, the information is being customised to suit Hyderabad’s conditions, helping identify the most congested corridors and plan interventions.
These insights will be available only to the police and not to the public. The department is yet to take a final decision on implementation, with financial discussions pending. Google Maps remains, for now, a tool better suited for guiding motorists than managing the city’s complex and unpredictable traffic flow.
Published – August 09, 2025 08:04 pm IST